
How I Reduced Jaeger Trace Loss in a Small AKS Cluster
DevOps & Cloud Engineer — building scalable, automated, and intelligent systems. Developer of sorts | Automator | Innovator
Introduction
Distributed tracing helps understand how services behave when requests travel through multiple microservices. Tools like Jaeger are very useful, but they can also consume significant memory and CPU resources. This becomes especially noticeable when the Kubernetes cluster is small.
In my case, I deployed Jaeger in a single-node Azure Kubernetes Service (AKS) cluster running on a Standard_D3_v2 node. At first, everything looked fine. But under real workload, traces began to disappear. Only some traces showed up, and sometimes none at all.
This is the story of why that happened and how I fixed it.
Cluster Context
| Component | Details |
| Cloud Provider | Azure Kubernetes Service (AKS) |
| Node Count | 1 |
| Node Type | Standard_D3_v2 (4 vCPU, 14 GB RAM) |
| Jaeger Deployment | All-in-One (Collector + Query + Agent) |
| Storage Backend (Initial) | In-memory |
| Storage Backend (Final) | Badger |
| Workload Type | Python application with moderate tracing volume |
The Problem
The issue was trace loss. When requests increased, Jaeger was not able to keep up. The UI showed missing spans and partial traces. Sometimes entire traces disappeared.
Why does this happen?
Reason #1: In-memory Storage Flushes Data Quickly
The default Jaeger all-in-one deployment uses in-memory storage. This is fast but extremely volatile. When memory fills up, older traces are dropped without warning.
Memory full → drop oldest spans → missing traces in UI
Reason #2: Single Node Means Shared Resource Pressure
AKS Standard_D3_v2 has only 4 vCPUs. When Jaeger collector competes with application workloads, the collector queue can start backing up:
Incoming spans → Collector queue → Storage
When the queue fills:
New spans are dropped
How I Diagnosed The Issue
I observed these symptoms:
CPU usage spikes near 80% on the Jaeger pod
Memory usage increasing until pod OOMKilled or auto-cleared
Jaeger logs showing queue warnings:
queue is full, dropping spans
This confirmed the root cause: Jaeger was overloaded.
The Fix
I applied two changes:
1. Increased Resource Requests and Limits
Example configuration:
resources:
  requests:
    cpu: "500m"
    memory: "1Gi"
  limits:
    cpu: "1500m"
    memory: "2Gi"
This ensured Jaeger received enough CPU shares and memory headroom.
2. Switched Storage Backend from In-Memory to Badger
Badger is a lightweight key-value storage engine suitable for single-node setups.
It avoids trace eviction caused by memory pressure.
Helm values change:
storage:
  type: badger
  badger:
    directory: /badger
    ephemeral: false
This allowed traces to persist longer and prevented sudden drops.
Results
| Before | After |
| Frequent trace loss | Stable trace retention |
| Collector queue warning logs | No queue overflow warnings |
| Unreliable observability | Consistent tracing in UI |
| Memory spikes | Controlled usage |
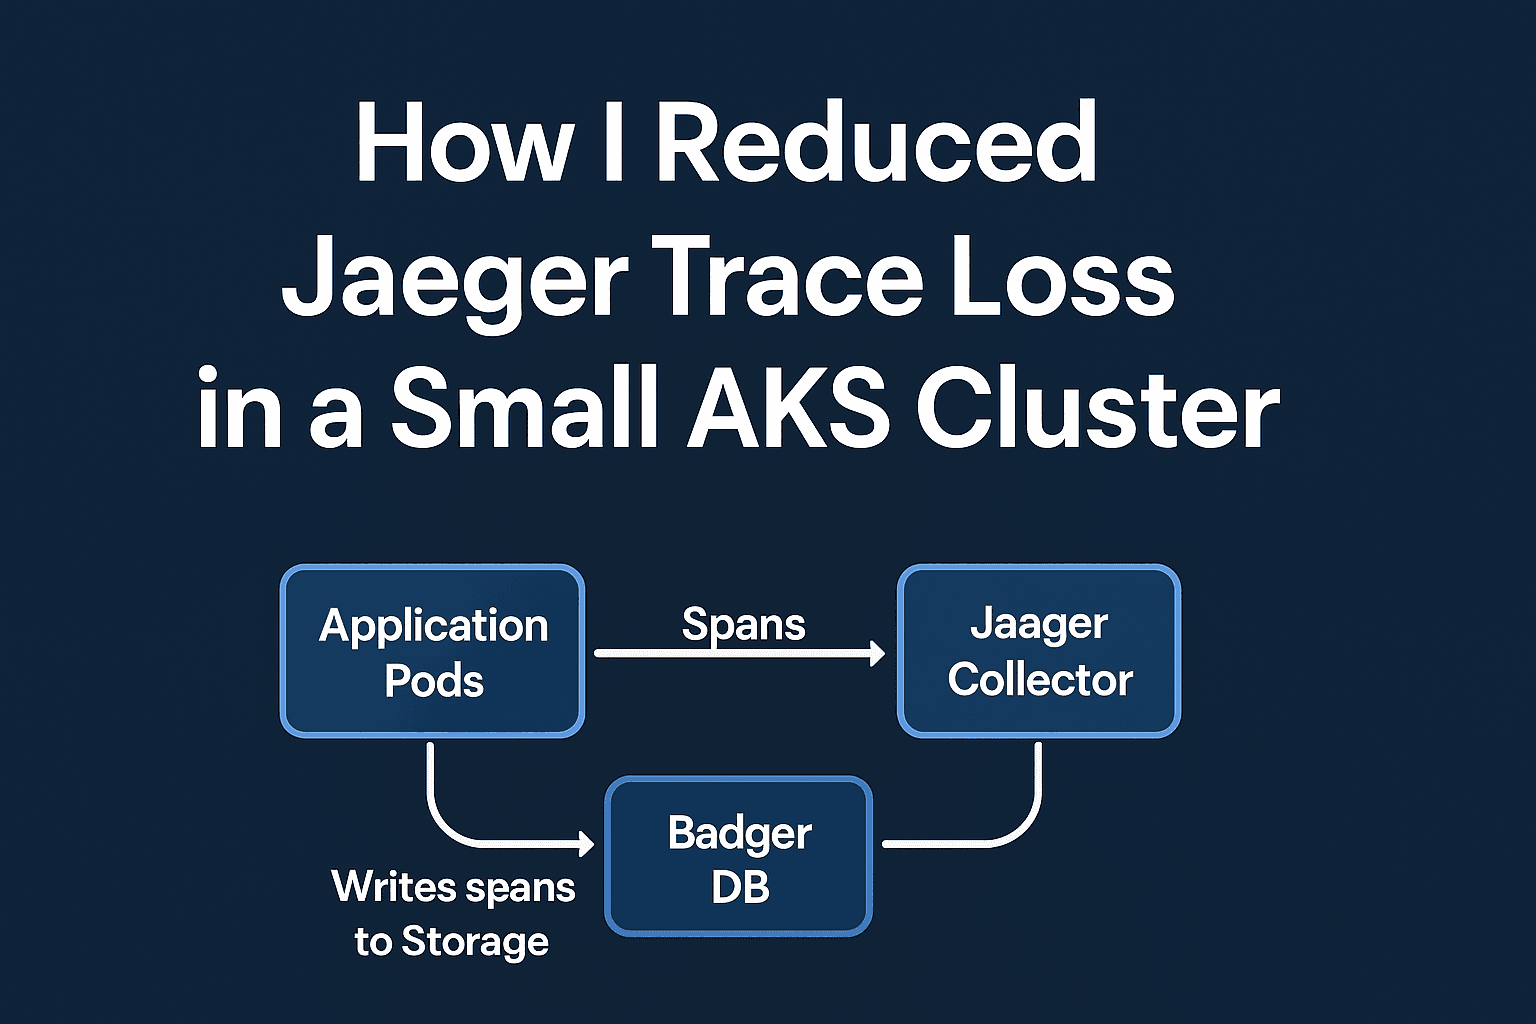
Simple Architecture Diagram

Now let us break down what each component does:
1. Application Pods
Your microservices or application containers generate trace spans.
Each span represents one part of a request, such as:
A database query
An HTTP call to another service
A background job
These spans help show how long each part of a request takes.
2. Jaeger Collector
The collector receives the span data from the application.
Think of it like a “mail sorting center”:
Apps send spans → Collector receives, batches, and writes them.
If the collector becomes overloaded or has no place to store spans, they get dropped — this is where trace loss happened before the fix.
3. Badger Storage
This is where the spans are actually stored.
With in-memory storage, data disappears when memory fills.
With Badger, spans are written to a lightweight key-value store on disk.
So instead of traces evaporating, they are retained long enough to view and analyze.
Simplifying the Flow
You can think of the whole system like this:
Your App → Sends Traces → Collector → Stores Traces → UI shows Traces
If any part in the middle breaks, you get missing traces.
By giving Jaeger more CPU / memory and switching storage to Badger, you ensured:
Collector did not choke under pressure
Spans were not dropped due to memory eviction
Traces became reliable and consistent
Key Takeaways
In-memory storage is fine for testing, but not for real workloads.
Even a small cluster can run Jaeger effectively, but resources must be allocated carefully.
Badger is a practical lightweight backend for non-production or low volume production clusters.
Observability is only useful when it is reliable.
Conclusion
Jaeger is powerful, but it requires thoughtful resource planning. In a small AKS cluster, the default configuration is not enough. Switching from in-memory storage to Badger, combined with slight resource tuning, solved the trace loss issue completely. The result was consistent distributed tracing and better insight into system behavior.
If you run a low-resource Kubernetes environment and notice missing traces, this approach may help you fix it quickly.