
Running Traccar on Kubernetes: Lessons Learned from Ingress, TCP Services, and Scaling
S
DevOps & Cloud Engineer — building scalable, automated, and intelligent systems. Developer of sorts | Automator | Innovator
Search for a command to run...
DevOps & Cloud Engineer — building scalable, automated, and intelligent systems. Developer of sorts | Automator | Innovator
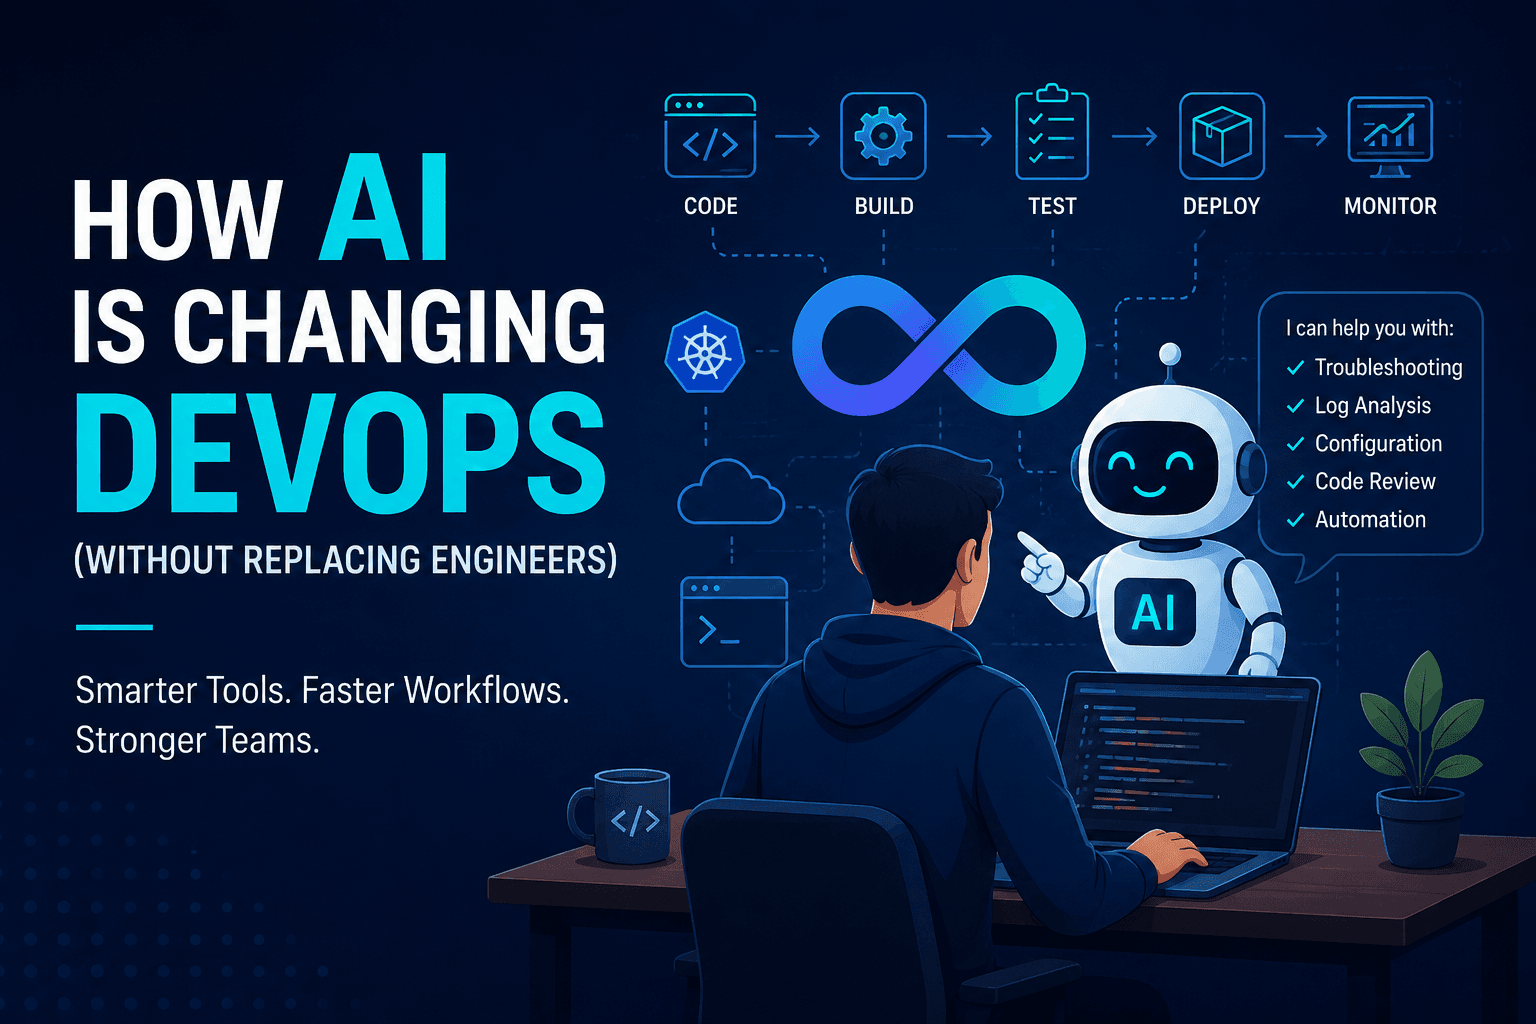
Artificial Intelligence has become one of the biggest talking points in software engineering. Every week, a new tool promises to automate deployments, fix production incidents, or replace developers a
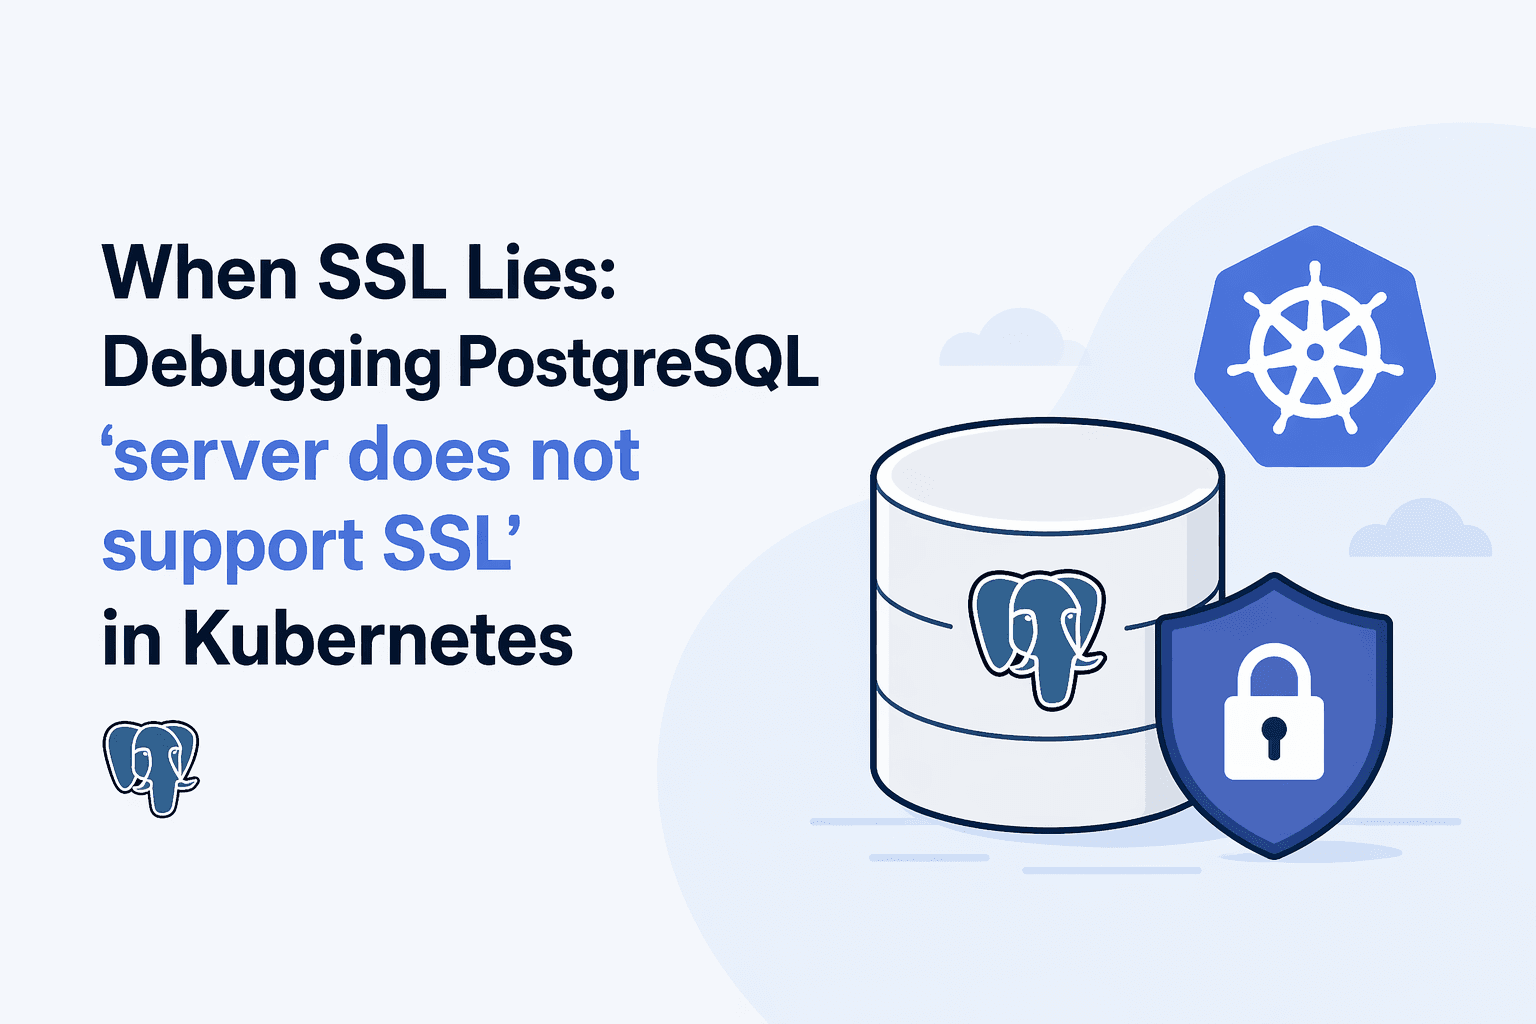
You spin up a Kubernetes workload. You connect to PostgreSQL. You add sslmode=require because security matters. And then PostgreSQL replies with: server does not support SSL, but SSL was required Wai
When you first approach Tencent Cloud, it feels familiar if you come from AWS or Azure. There are VPCs, Kubernetes clusters, load balancers, object storage, IAM, everything you would expect. But once
When I first automated Docker builds and deployments, I thought the hard part would be writing the YAML. It was not. The real challenges were versioning, preventing accidental rollbacks, handling envi
For a long time, Docker Compose felt like the perfect solution. Simple YAML, fast local setup, predictable behavior. For a single service or even a small stack, it works beautifully. But at some point, reality catches up. As the application grew, tra...
CodeOps Studies
40 posts
Simple write-ups on day to day code or devops experiments, tests etc.
Traccar looks simple on the surface. It is just a GPS tracking server with a web interface. Once you attempt to run it in Kubernetes, especially for real device traffic, you quickly realize that it is not a typical HTTP application. Traccar is a mix of HTTP, long-lived TCP connections, multiple device protocols, and stateful behavior that does not always align cleanly with cloud-native assumptions.
This post documents what worked, what did not, and why certain architectural decisions were made while running Traccar on Kubernetes. The goal is not to present a perfect reference architecture, but to share practical lessons learned from real deployments and iterations.
Before touching Kubernetes, it is important to understand how Traccar actually receives traffic.
The Traccar web interface is a standard HTTP application. It runs on port 8082 by default and can be exposed using any normal HTTP reverse proxy.
Device traffic is very different. Each GPS device speaks its own protocol. These protocols are almost always raw TCP. Examples include:
Port 5027 for Teltonika devices like FMB125
Port 5004 for OsmAnd
Many other ports depending on protocol configuration
Devices open long-lived TCP connections and continuously send data. They do not behave like short HTTP requests. This distinction heavily influences how Kubernetes networking must be designed.
The first deployment followed a standard Kubernetes pattern.
Traccar ran in a Deployment
A ClusterIP Service exposed ports 8082, 5027, and 5004
An NGINX Ingress exposed the web interface on a domain
The web interface worked immediately. Logging in, viewing devices, and maps all functioned correctly.
Device connections did not.
At first, it looked like a firewall or security group issue. Ports were open. Services existed. Pods were running. Logs showed no incoming device traffic.
The core mistake was assuming that Kubernetes Ingress could route arbitrary TCP traffic in the same way it routes HTTP.
Kubernetes Ingress is an HTTP abstraction. It understands hosts, paths, headers, and HTTP semantics.
Traccar device protocols are raw TCP. There is no HTTP handshake, no headers, and no routing metadata.
Most Ingress controllers, including NGINX Ingress, completely ignore non-HTTP traffic unless explicitly configured to handle TCP streams.
This is why simply adding device ports to a Service and expecting Ingress to route them does not work.
This represents the first attempt where Traccar was treated like a normal HTTP application.

Why this failed
Ingress only understood HTTP
TCP packets from devices were silently dropped
No errors were obvious unless Ingress logs were inspected carefully
This is useful to show that nothing looked wrong from a Kubernetes resource perspective, yet device traffic never arrived.
The simplest working solution was to create a separate Service of type LoadBalancer for device ports.
One LoadBalancer for ports 5027, 5004, and others
Another Ingress for the web UI
This worked immediately. Devices connected successfully and data started flowing.
However, this approach had clear downsides.
Every LoadBalancer costs money
Managing DNS and certificates becomes fragmented
Operational complexity increases with each additional protocol
For a small setup this might be acceptable. For a production system with many protocols, it quickly becomes messy.

Why this worked
Kubernetes LoadBalancer services handle raw TCP natively
Devices connected immediately
Why this was not ideal
Multiple public IPs
Higher cost
DNS and certificate management became fragmented
Scaling to many protocols would multiply LoadBalancers
This is important because it shows a valid stepping stone, not a mistake.
The more scalable approach was to use NGINX Ingress TCP services.
NGINX Ingress supports raw TCP forwarding through a ConfigMap. This feature is not enabled by default and requires explicit configuration.
Instead of using an Ingress resource, TCP ports are mapped directly in a ConfigMap.
Example:
apiVersion: v1
kind: ConfigMap
metadata:
  name: tcp-services
  namespace: ingress-nginx
data:
  "5027": "traccar/traccar:5027"
  "5004": "traccar/traccar:5004"
This tells the NGINX Ingress controller:
Listen on port 5027
Forward raw TCP traffic to the Traccar Service on port 5027
The NGINX Ingress controller must also be started with flags enabling TCP services:
--tcp-services-configmap=ingress-nginx/tcp-services
Once this was configured correctly, device traffic started flowing without any separate LoadBalancer.

Key points this diagram communicates
One public entry point
HTTP and TCP are handled differently but coexist cleanly
No extra LoadBalancers
Devices and users share the same domain, different ports
This is the centerpiece of the blog.
With TCP services enabled, the architecture became much cleaner.
One NGINX Ingress LoadBalancer
HTTP traffic routed via Ingress rules
TCP traffic routed via ConfigMap
One public IP
One DNS domain
Devices connected to the same IP or domain, simply using different ports.
This was the first setup that felt production-ready.
Some devices, including Teltonika FMB125, support connecting to a domain name instead of an IP address.
This was important for flexibility.
A CNAME record was created pointing to the Ingress LoadBalancer DNS name.
Example:
traccar.example.com -> ingress-lb.amazonaws.com
Devices were configured to connect to traccar.example.com:5027.
This allowed infrastructure changes without touching device configurations, which is critical once devices are deployed in the field.

Devices never depend on a fixed IP
Infrastructure can change underneath
Field devices remain untouched
This is often overlooked but is critical in real deployments.
At this point, the next natural step was scaling.
Horizontal Pod Autoscaler was enabled based on CPU usage. Traccar pods scaled up as load increased.
This is where another subtle issue appeared.
When a device connects over TCP, the connection is established to a specific pod through NGINX. That connection stays open for a long time.
If the pod restarts, the connection drops. Devices reconnect, but not always immediately.
If traffic is distributed across multiple pods, each pod holds its own set of device connections. This is not inherently bad, but it has consequences:
Pod restarts cause device disconnects
Rolling updates must be carefully controlled
Aggressive autoscaling can harm connection stability
For this reason, scaling Traccar is not as simple as scaling stateless HTTP services.

TCP connections are sticky
Restarting a pod drops active devices
Autoscaling must be conservative
Rolling updates must avoid simultaneous pod restarts
This visually explains why Traccar is not truly stateless.
Lessons on Scaling Strategy
A few practical rules emerged.
Keep a minimum number of replicas to avoid cold starts
Avoid frequent pod restarts
Use rolling updates with maxUnavailable set to zero
Scale based on memory and connection count, not only CPU
In some cases, vertical scaling provided more stability than horizontal scaling.

Running the database inside the cluster was tested initially.
This was quickly abandoned.
Traccar is stateful. Device positions, events, and history must never be lost. Kubernetes pods are ephemeral by design.
Moving PostgreSQL to a managed service like RDS simplified operations significantly.
Backups became reliable
Pod restarts no longer risked data integrity
Performance was more predictable
This separation of concerns was one of the most important architectural decisions.
Debugging TCP traffic is harder than debugging HTTP.
A few practices helped significantly:
Enable detailed Traccar protocol logs temporarily
Use kubectl logs with timestamps
Test device connections using netcat or protocol simulators
Monitor NGINX Ingress logs for connection errors
Blindly assuming that devices are sending data is a common mistake. Always validate traffic at each layer.
Building a custom Traccar image simplified deployment.
Web UI built once
Backend and frontend shipped together
Image pushed to a registry
Kubernetes deployment updated with new tag
This avoided runtime builds and reduced startup time.
Automated image tagging and controlled rollouts were critical to avoid accidental mass disconnects during updates.
The final stable setup looked like this:
Traccar runs as a Deployment in Kubernetes
PostgreSQL runs outside the cluster
NGINX Ingress exposes:
HTTP via Ingress rules
TCP device ports via TCP services ConfigMap
One LoadBalancer
Devices connect using a domain name
Scaling is conservative and connection-aware
This architecture balanced Kubernetes flexibility with the realities of long-lived TCP connections.
Traccar can run very well on Kubernetes, but only if it is treated as a mixed-protocol, semi-stateful system rather than a simple web application.
The biggest lesson was that Kubernetes abstractions are powerful, but they do not remove the need to understand how applications actually communicate.
If you respect Traccar’s networking model and design around it, Kubernetes becomes an advantage rather than a source of constant friction.
Thanks to mermaid.live to be able to use it to create these flow diagrams!